Research project · 2025
Scale-aware Co-visible Region Detection for Image Matching
- State Key Laboratory of Information Engineering in Surveying, Mapping and Remote Sensing (LIESMARS), Wuhan University
- The VITA Lab, École Polytechnique Fédérale de Lausanne (EPFL)
* Corresponding author
Abstract
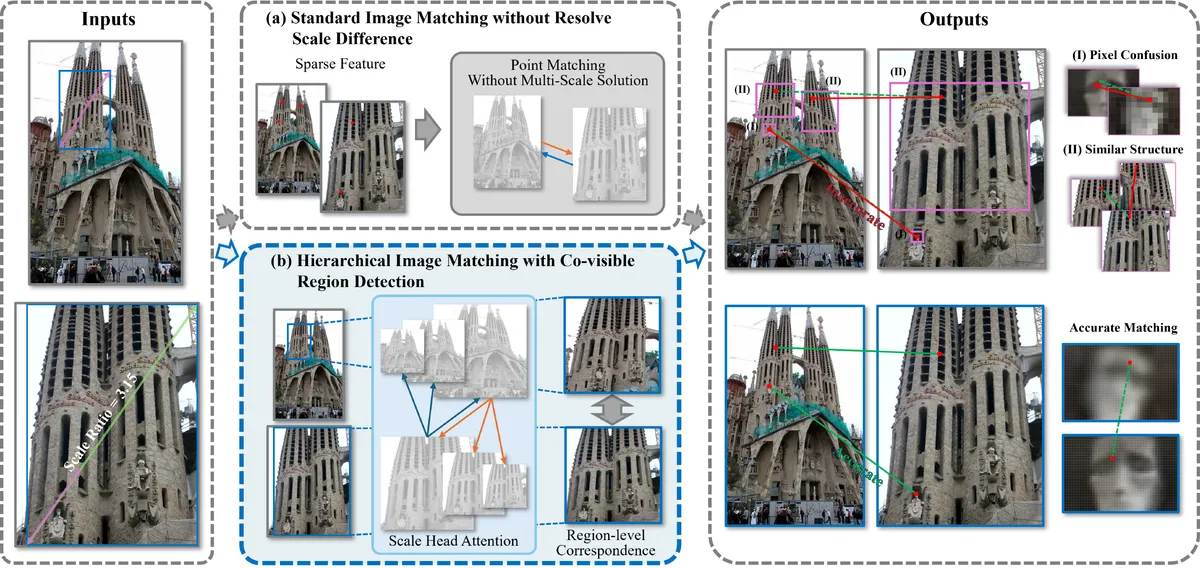
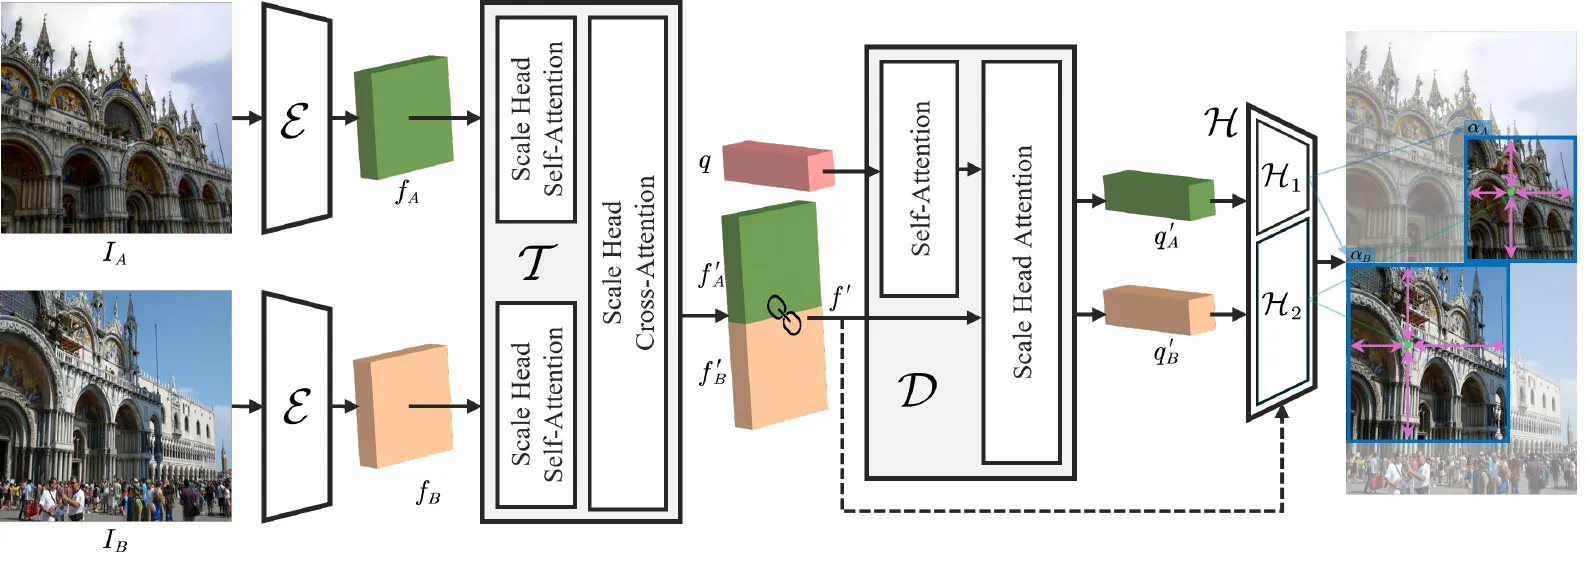
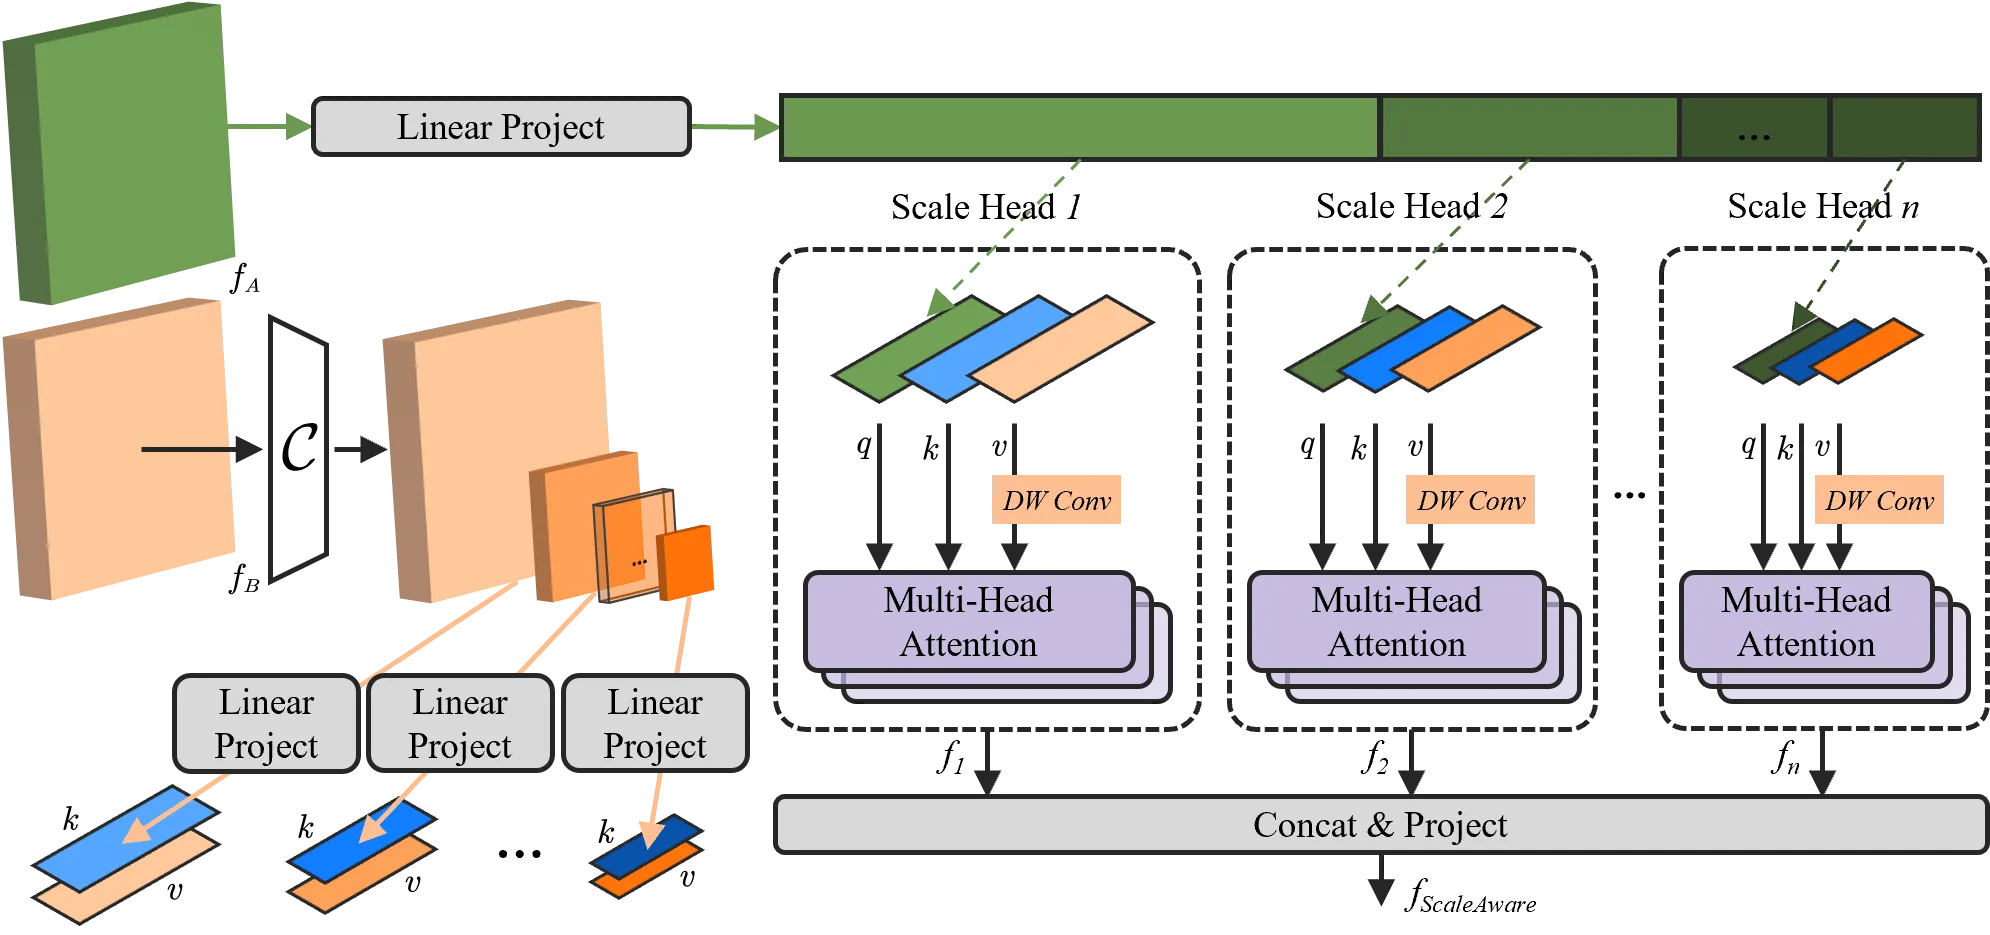
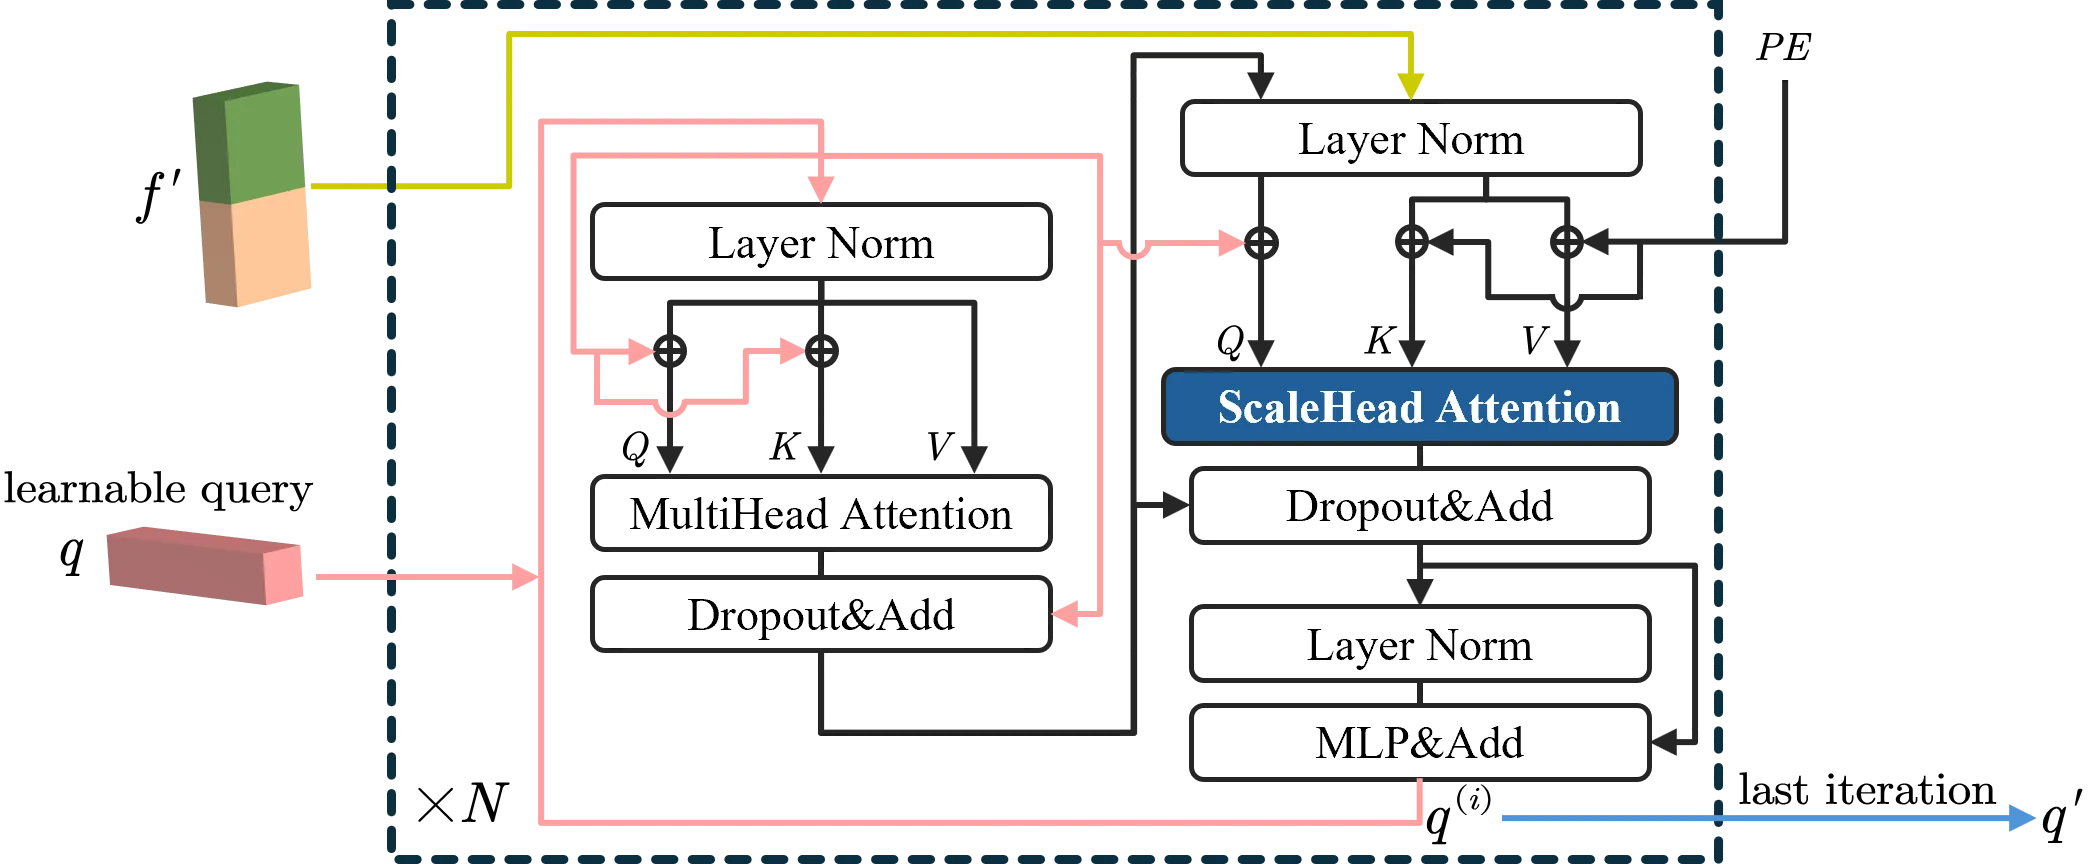
Large scale differences weaken appearance consistency and make keypoint localization uncertain. SCoDe[1]—Scale-aware Co-visible Region Detector—introduces an intermediate region-level correspondence before point matching: it detects the content jointly visible in both images, aligns those regions in scale, and then confines fine correspondence estimation to them. Scale Head Attention correlates features across multiple scale subspaces, while learnable queries aggregate evidence from both views. This coarse-to-fine formulation improves matching precision by up to 8.41% and remains effective across different matching backbones.
Method
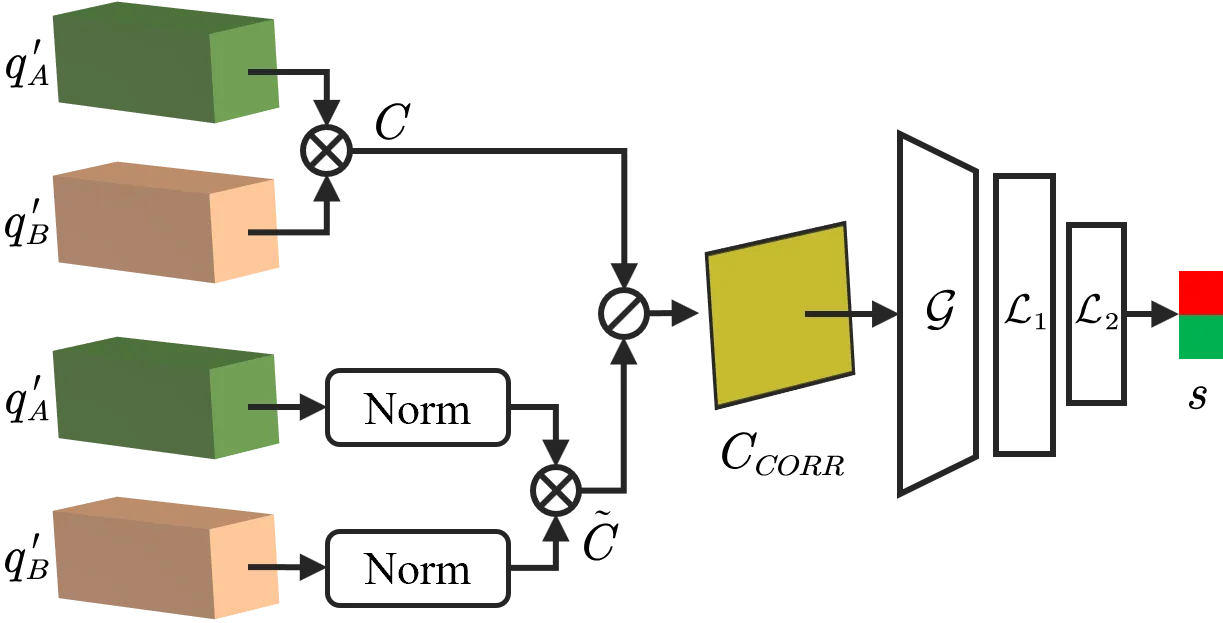
Hierarchical matching
Region alignment reduces scale and semantic ambiguity before local descriptors establish point correspondences.
Scale Head Attention
Multiple scale-specific subspaces model correlations that conventional same-scale attention can miss.
Validity-aware prediction
Anchors, border offsets, and confidence jointly describe where co-visible support exists and whether a valid region should be returned.
Evaluation
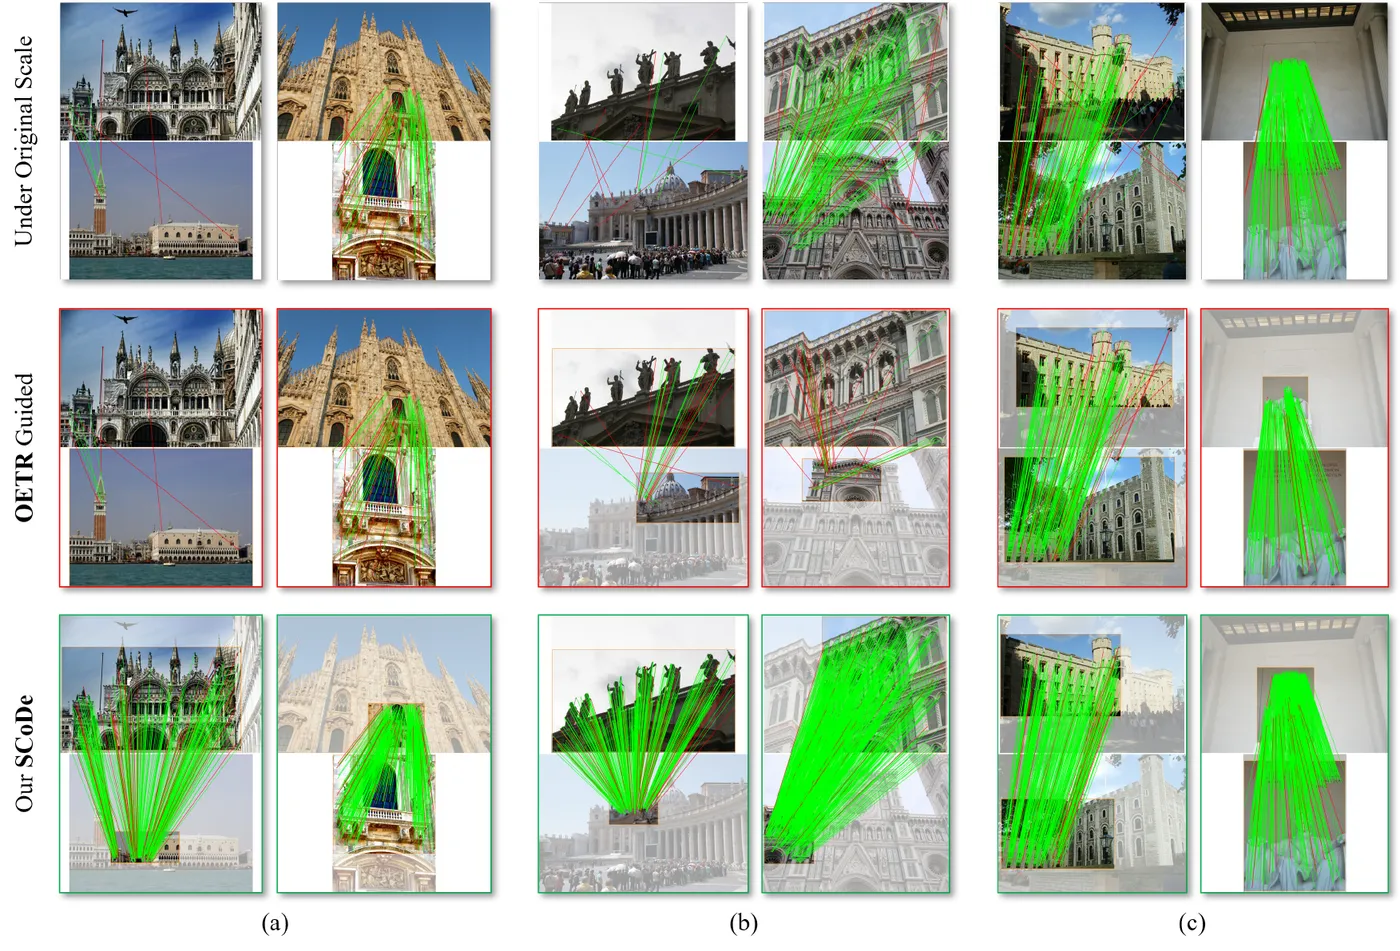
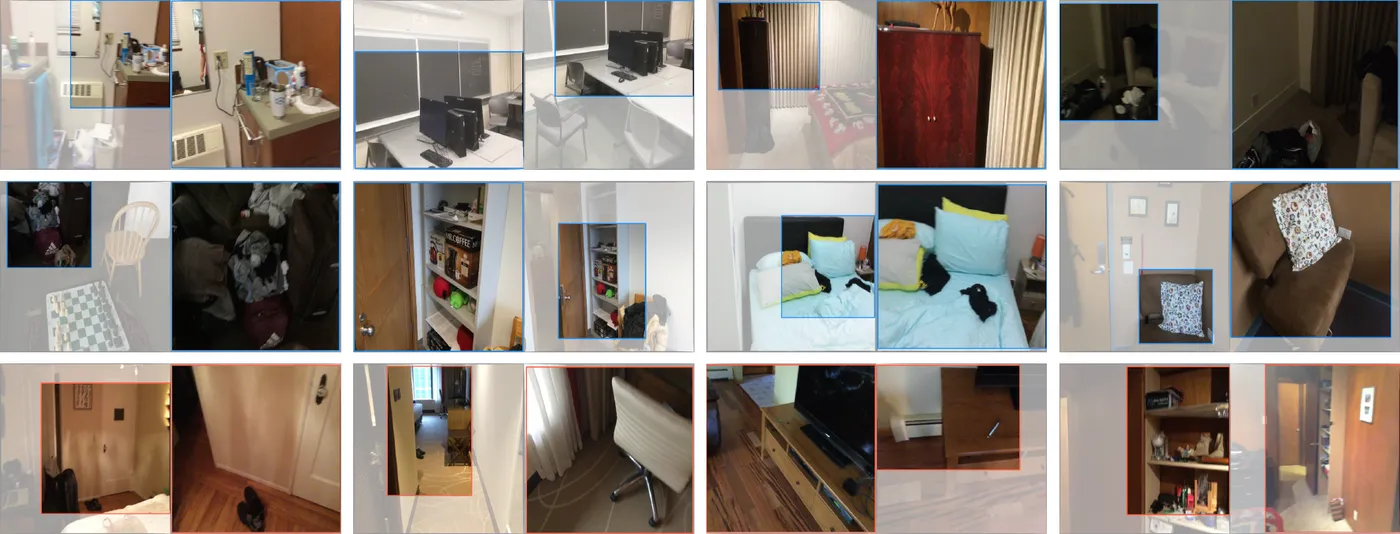
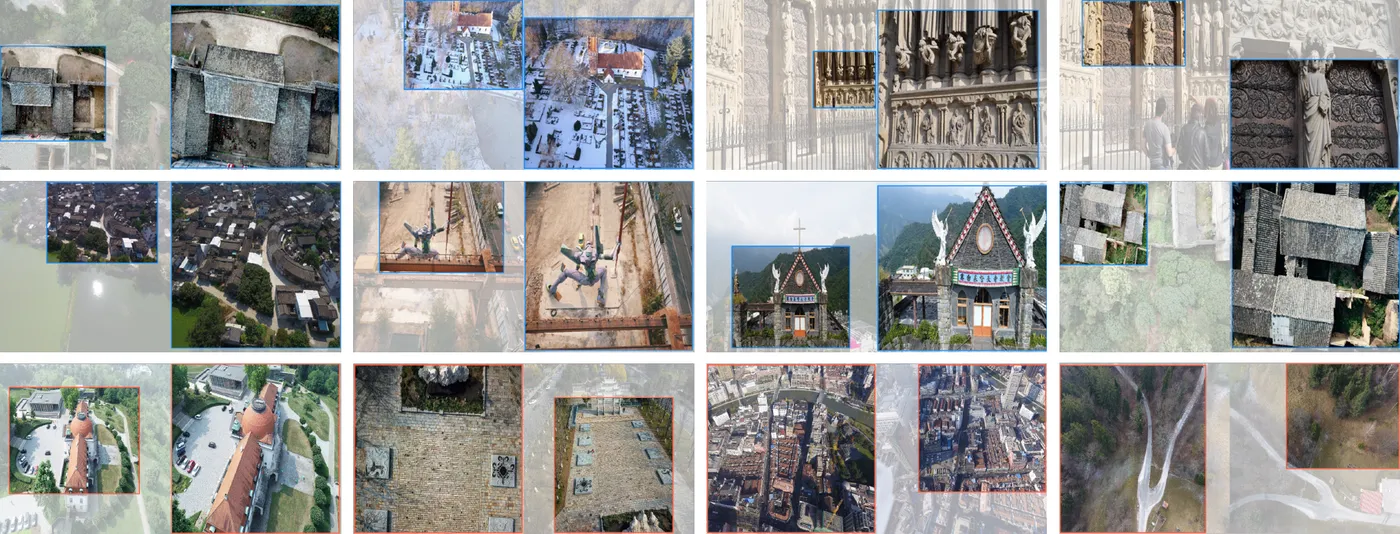
Training and primary evaluation use MegaDepth[2], with 3,000 test pairs selected from ten scenes and ray-cast co-visible ground truth. Region detection is measured with confidence recall, IoU recall, overlap IoU (OIoU), and mean IoU. Downstream matching uses pose AUC, accuracy, mAA, precision, and matching score across classical, sparse learned, SuperGlue[4], and dense LoFTR[5] pipelines. We compare region guidance against OETR[3]. ScanNet[6] and GL3D[7] provide qualitative cross-domain tests.
| Method | IoU@.5 | IoU@.75 | OIoU@.9 | mIoU |
|---|---|---|---|---|
| OETR* | 87.40 | 60.71 | 70.90 | 76.71 |
| OETR (cyclecenter) | 90.71 | 59.03 | 52.36 | 77.29 |
| SCoDe | 94.69 | 71.43 | 74.82 | 81.98 |
| Variant | mIoU | Conf | IoU | OIoU |
|---|---|---|---|---|
| w/o ScaleHead | 77.29 | 98.69 | 62.42 | 88.61 |
| w/o DWConv | 78.41 | 98.74 | 64.03 | 87.19 |
| w/o confidence | 79.86 | – | 66.53 | 89.18 |
| SCoDe | 82.02 | 99.62 | 69.82 | 87.66 |
Results
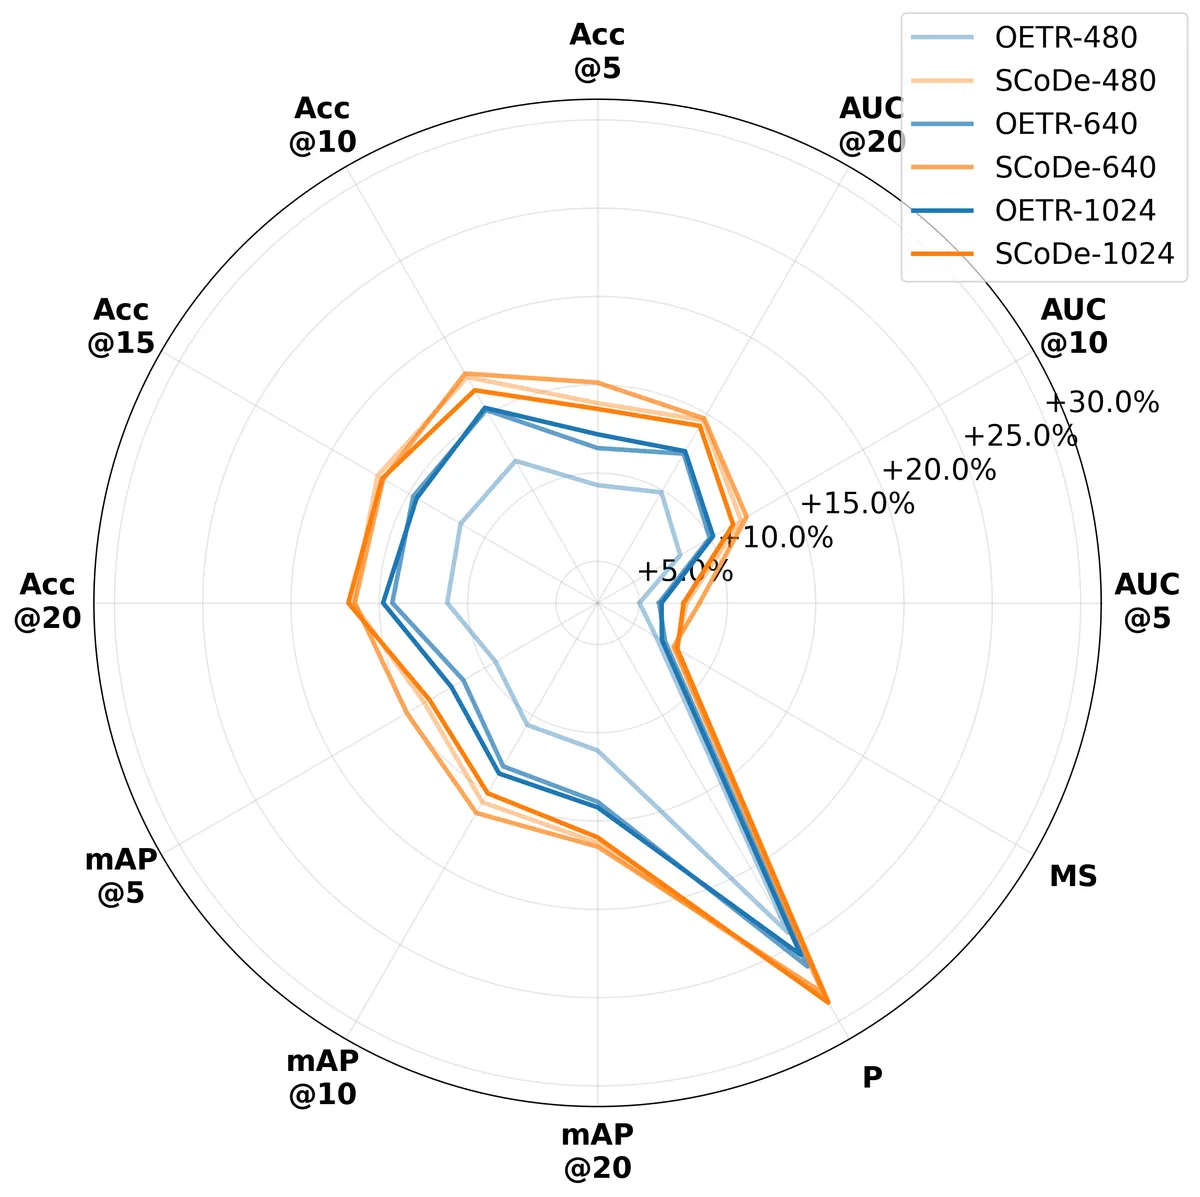
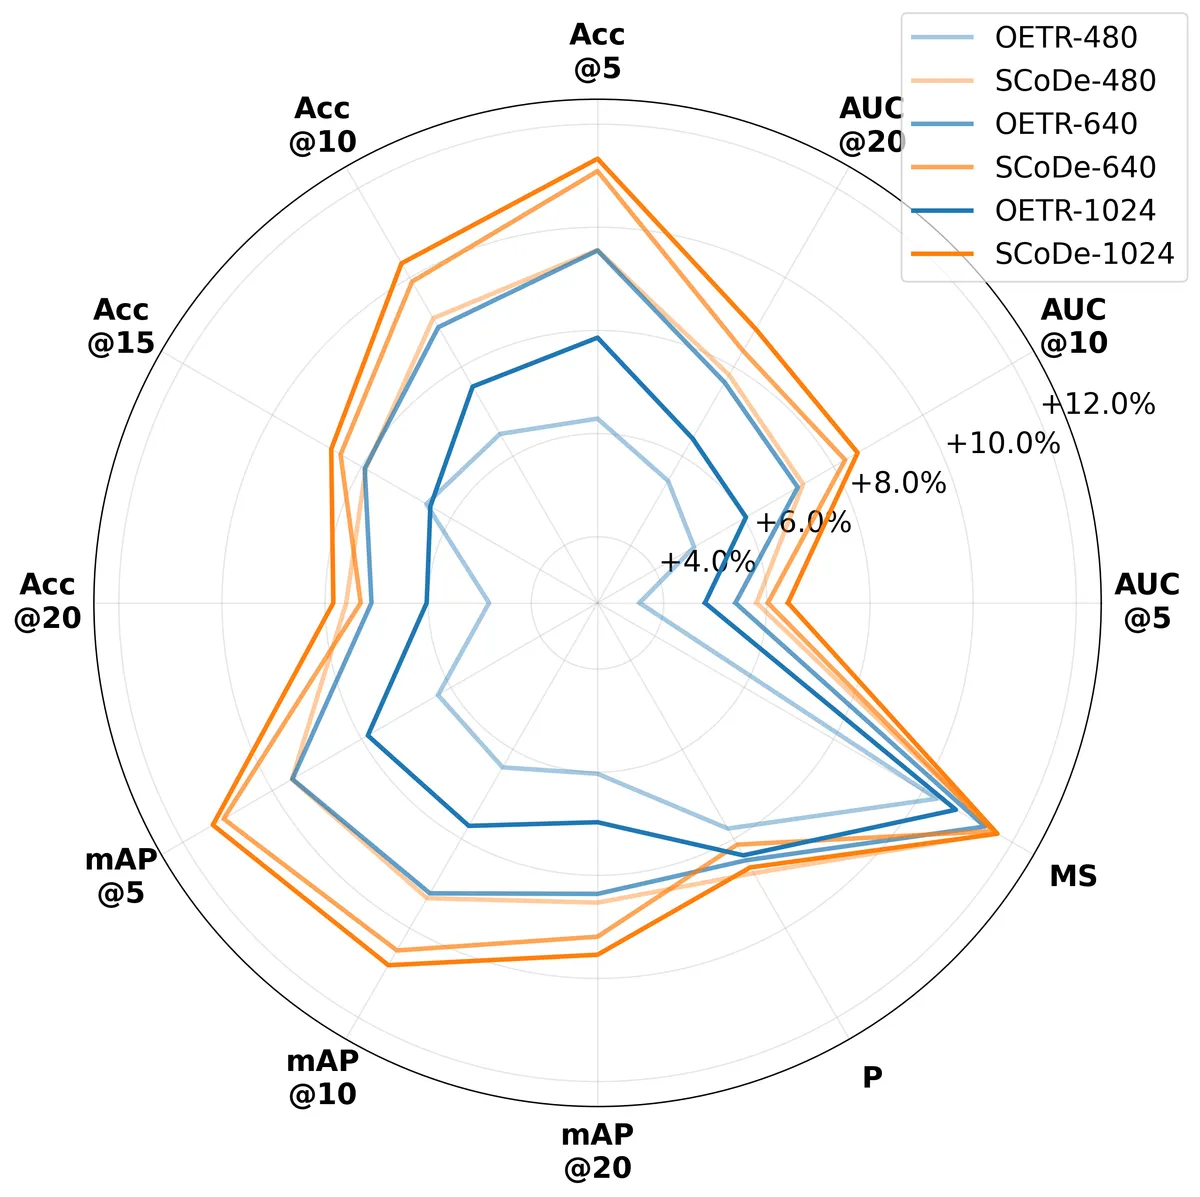
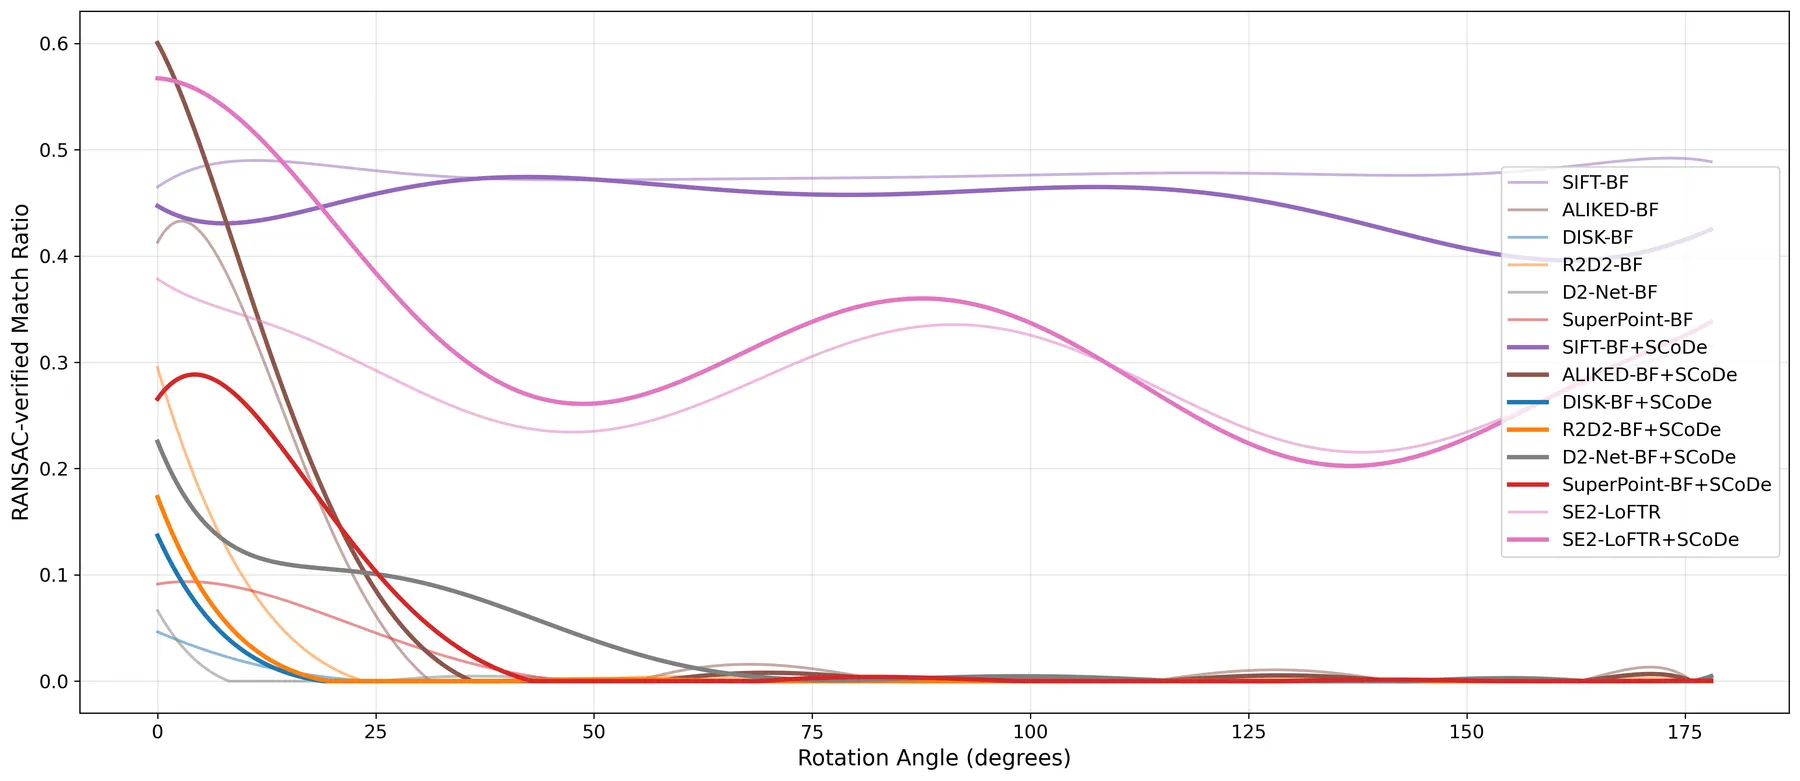
SCoDe’s gains grow as scale ratios become more severe: accurate region boundaries remove unrelated content, aligned crops reduce repetitive-pattern ambiguity, and the same prior improves otherwise very different local matching architectures.
| Pipeline | Prior | AUC@5 | AUC@10 | AUC@20 | Acc@5 | Acc@10 | Acc@15 | Acc@20 | mAA@5 | mAA@10 | mAA@20 | P | MS |
|---|---|---|---|---|---|---|---|---|---|---|---|---|---|
| SP+NN | – | 2.26 | 3.81 | 5.91 | 3.91 | 6.15 | 7.64 | 9.90 | 3.91 | 5.03 | 6.90 | 11.54 | 3.13 |
| SP+NN | +OETR | 10.16 | 16.54 | 23.55 | 18.52 | 26.24 | 30.77 | 33.49 | 18.52 | 22.38 | 27.26 | 31.29 | 7.92 |
| SP+NN | +SCoDe | 13.75 | 22.57 | 32.33 | 24.49 | 35.81 | 42.27 | 46.34 | 24.49 | 30.15 | 37.23 | 41.30 | 10.21 |
| DISK+NN | – | 3.30 | 4.95 | 6.70 | 5.31 | 7.12 | 8.29 | 9.19 | 5.31 | 6.22 | 7.48 | 16.89 | 0.52 |
| DISK+NN | +OETR | 21.04 | 33.35 | 46.19 | 37.36 | 51.80 | 59.41 | 64.15 | 37.36 | 44.58 | 53.18 | 60.88 | 12.11 |
| DISK+NN | +SCoDe | 23.10 | 35.81 | 48.81 | 40.15 | 54.67 | 61.97 | 67.02 | 40.15 | 47.41 | 55.95 | 63.72 | 14.05 |
| D2+NN | – | 0.36 | 0.61 | 1.35 | 0.53 | 1.05 | 1.76 | 2.80 | 0.53 | 0.79 | 1.53 | 6.12 | 2.68 |
| D2+NN | +OETR | 4.17 | 6.73 | 10.18 | 7.26 | 10.90 | 13.38 | 16.00 | 7.26 | 9.08 | 11.89 | 23.10 | 2.87 |
| D2+NN | +SCoDe | 5.70 | 9.54 | 14.53 | 10.59 | 15.32 | 19.38 | 22.79 | 10.59 | 12.95 | 17.02 | 29.86 | 3.23 |
| CON+NN | – | 20.43 | 32.56 | 46.10 | 36.19 | 51.86 | 60.08 | 64.77 | 36.19 | 44.03 | 53.23 | 61.69 | 7.68 |
| CON+NN | +OETR | 23.32 | 37.10 | 51.29 | 41.75 | 57.81 | 65.78 | 70.62 | 41.75 | 49.78 | 58.99 | 67.45 | 11.21 |
| CON+NN | +SCoDe | 25.63 | 39.72 | 53.90 | 44.58 | 60.77 | 68.56 | 72.94 | 44.58 | 52.67 | 61.71 | 68.80 | 12.32 |
| ASL+NN | – | 11.44 | 19.21 | 28.79 | 20.67 | 31.46 | 38.67 | 43.73 | 20.67 | 26.07 | 33.64 | 38.68 | 18.40 |
| ASL+NN | +OETR | 21.95 | 35.94 | 50.88 | 40.25 | 57.20 | 66.22 | 71.17 | 40.25 | 48.73 | 58.71 | 60.89 | 34.55 |
| ASL+NN | +SCoDe | 23.83 | 38.28 | 53.41 | 42.87 | 60.39 | 68.97 | 73.52 | 42.87 | 51.63 | 61.44 | 64.55 | 38.17 |
| LoFTR | – | 25.37 | 37.82 | 49.61 | 42.86 | 55.44 | 61.45 | 66.17 | 42.86 | 49.15 | 56.48 | 48.21 | 40.76 |
| LoFTR | +OETR | 31.70 | 47.14 | 60.55 | 53.71 | 68.73 | 74.24 | 77.75 | 53.71 | 61.22 | 68.61 | 71.22 | 46.70 |
| LoFTR | +SCoDe | 34.11 | 50.14 | 64.35 | 57.55 | 72.63 | 78.72 | 82.16 | 57.55 | 65.09 | 72.76 | 76.54 | 48.42 |
| R2D2+NN | – | 12.86 | 22.46 | 33.22 | 25.34 | 36.81 | 44.52 | 49.13 | 25.34 | 31.08 | 38.95 | 39.60 | 85.15 |
| R2D2+NN | +OETR | 24.96 | 39.90 | 55.20 | 44.52 | 61.85 | 71.19 | 75.42 | 44.52 | 53.19 | 63.24 | 65.09 | 88.39 |
| R2D2+NN | +SCoDe | 27.20 | 42.96 | 58.25 | 48.60 | 66.18 | 74.26 | 77.99 | 48.60 | 57.39 | 66.76 | 68.84 | 88.64 |
| DISK+SG | – | 15.69 | 25.91 | 37.27 | 28.88 | 42.00 | 48.79 | 53.40 | 28.88 | 35.44 | 43.27 | 35.45 | 6.98 |
| DISK+SG | +OETR | 21.04 | 33.35 | 46.19 | 37.36 | 51.80 | 59.41 | 64.15 | 37.36 | 44.58 | 53.18 | 60.88 | 12.11 |
| DISK+SG | +SCoDe | 23.10 | 35.81 | 48.81 | 40.15 | 54.67 | 61.97 | 67.02 | 40.15 | 47.41 | 55.95 | 63.72 | 14.05 |
| SP+SG | – | 25.11 | 39.23 | 54.03 | 44.23 | 60.33 | 69.44 | 74.86 | 44.23 | 52.28 | 62.21 | 79.14 | 9.88 |
| SP+SG | +OETR | 29.32 | 45.56 | 61.37 | 51.02 | 69.02 | 77.99 | 82.07 | 51.02 | 60.02 | 70.03 | 86.17 | 19.00 |
| SP+SG | +SCoDe | 31.18 | 48.27 | 63.77 | 55.06 | 72.38 | 79.85 | 83.87 | 55.06 | 63.72 | 72.79 | 87.55 | 21.51 |
Citation
@article{pan2025scode,
  title={Scale-aware Co-visible Region Detection for Image Matching},
  author={Pan, Xu and Xia, Zimin and Zheng, Xianwei},
  journal={ISPRS Journal of Photogrammetry and Remote Sensing},
  year={2025},
  doi={10.1016/j.isprsjprs.2025.08.015}
}References
- X. Pan, Z. Xia, and X. Zheng. “Scale-aware Co-visible Region Detection for Image Matching.” ISPRS JPRS, 2025. DOI
- Z. Li and N. Snavely. “MegaDepth.” CVPR, 2018. arXiv
- H. Chen et al. “A Span-Based Object-Level Region Proposal Network for Scene Matching.” CVPR, 2022. arXiv
- P.-E. Sarlin et al. “SuperGlue.” CVPR, 2020. arXiv
- J. Sun et al. “LoFTR.” CVPR, 2021. arXiv
- A. Dai et al. “ScanNet.” CVPR, 2017. arXiv
- T. Shen et al. “Matchable Image Retrieval by Learning from Surface Reconstruction.” ACCV, 2018. arXiv